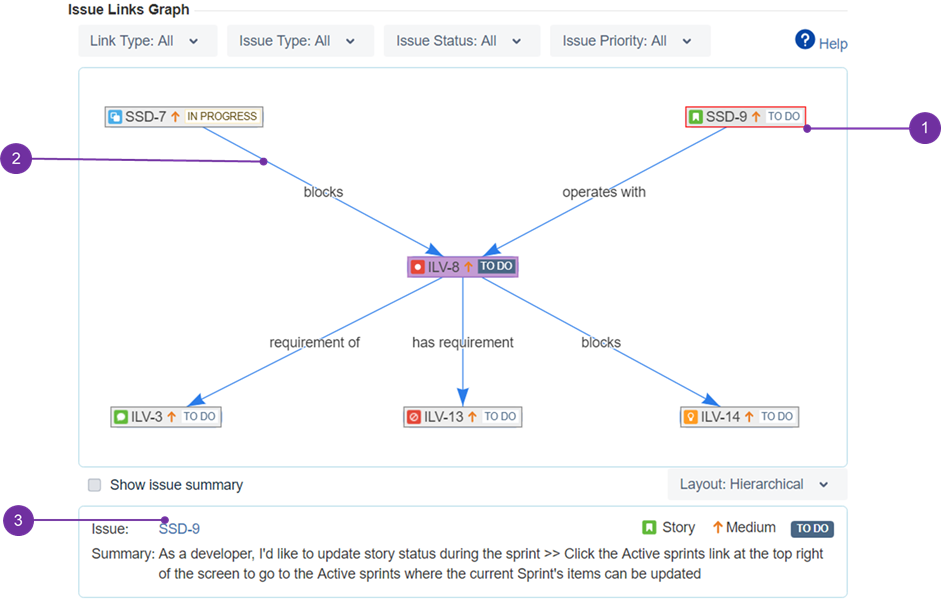
Core element of the plugin is the graph. It visualizes connections between issues based on defined links. The graph has following features:
- Click on an issue to display its details below the graph. Selected issue is marked with red border (1)
- Arrows show the direction and type of a link between issues (2)
- Open selected issue quickly by clicking on its key (3)
- Zoom in and out the graph by using mouse wheel (pointer must be placed over the graph)
- Move the graph, (within its bordered area) by using drag and drop technique. It can be done by pressing left mouse button when pointer is over a an empty space, or a linking arrow.
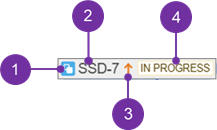
Every issue displayed in the graph contains such set of information:
- Issue type icon (1)
- Issue key (2)
- Issue priority icon (3)
- Issue status (4)

